Article
Featured Article: “Inventing the Workflow: How Phoenix LiDAR Helped Build the Market It Now Serves” from xyHt.
Commercial UAV LiDAR has evolved from a niche technology into an essential tool for surveying, engineering, utilities, transportation, and infrastructure mapping. That transformation was driven not only by advances in sensors, but also by the development of complete workflows that made the technology practical and repeatable in the field.
In this feature published by xyHt, the publication explores Phoenix LiDAR’s role in helping establish the commercial UAV LiDAR market through innovations in hardware integration, software development, customer training, and workflow automation. The article looks back at the industry’s early challenges and examines how complete mapping solutions helped accelerate adoption across the geospatial community.
The feature also examines the evolution of Phoenix LiDAR Systems, from its founding by Grayson Omans and Ben Adler to its acquisition by Revolution Geosystems. By combining Phoenix’s turnkey LiDAR hardware and software expertise with Revolution’s aviation and equipment rental services, the partnership strengthens its ability to provide comprehensive geospatial solutions spanning data acquisition, processing, and project support.
Read the full feature on the xyHt website to learn more about the evolution of commercial UAV LiDAR and Phoenix LiDAR’s contribution to the industry.
Related Resources:
Featured Article: “Designing LiDAR Around the Workflow” from xyHt
Survey-grade mapping depends on far more than advanced sensors. It requires a complete workflow that connects mission planning, data acquisition, calibration, processing, quality control, and final deliverables into a consistent, repeatable process.
In this feature published by xyHt, Phoenix LiDAR President Rob Dannenberg discusses why the company has built its hardware, software, and deployment model around the workflow rather than individual platforms.
The article explores how modular hardware, integrated software, automation, and platform-agnostic design help surveying and infrastructure professionals achieve consistent results regardless of vehicle collection method. By creating a strong, singular workflow, Phoenix LiDAR users can use the same workflow regardless of the acquisition platform. For example, the RANGER-Flex system is designed to be used across vehicles: UAV, mobile, backpack, and even manned aircraft.
Read the full feature on the xyHt website to learn more about the history of UAV LiDAR and how workflow innovation continues to drive the industry forward.
Related Resources:

Featured Article: “The Chain That Counts” from xyHt
Producing survey-grade drone data requires more than advanced sensors; it depends on an integrated workflow that ensures accuracy from collection through final deliverables.
At XPONENTIAL 2026 in Detroit, industry leaders from across the geospatial ecosystem gathered to discuss one of the biggest challenges facing drone mapping today: transforming raw sensor data into survey-grade deliverables that professionals can trust. The panel explored every stage of the workflow from positioning and sensor fusion to quality assurance, GIS integration, and final project delivery.
Phoenix LiDAR President Rob Dannenberg joined representatives from Trimble Applanix, GEODNET, and Esri to share practical insights into the technologies, processes, and industry standards that help ensure reliable mapping results. The discussion also addressed evolving topics including GNSS corrections, SLAM, ground control, quality control, workforce development, and what “survey grade data” really means in today’s geospatial industry.
This article, published by xyHt, provides an excellent overview of the complete drone mapping workflow and the considerations that separate successful data collection from dependable project deliverables.
Read the full article “The Chain That Counts” on the xyHt website.
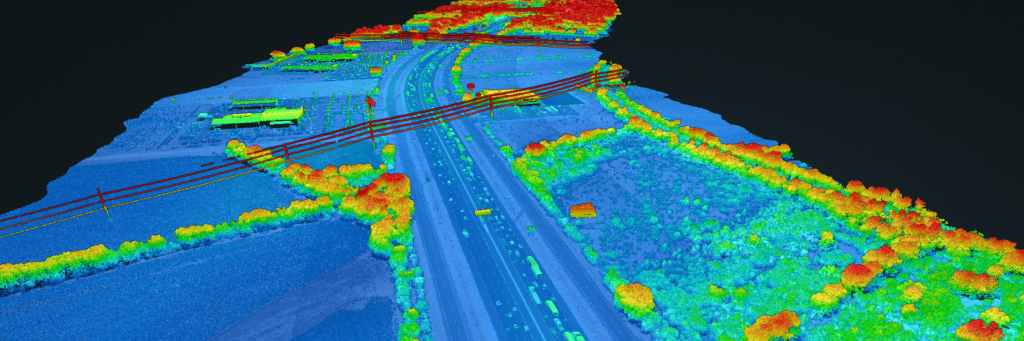
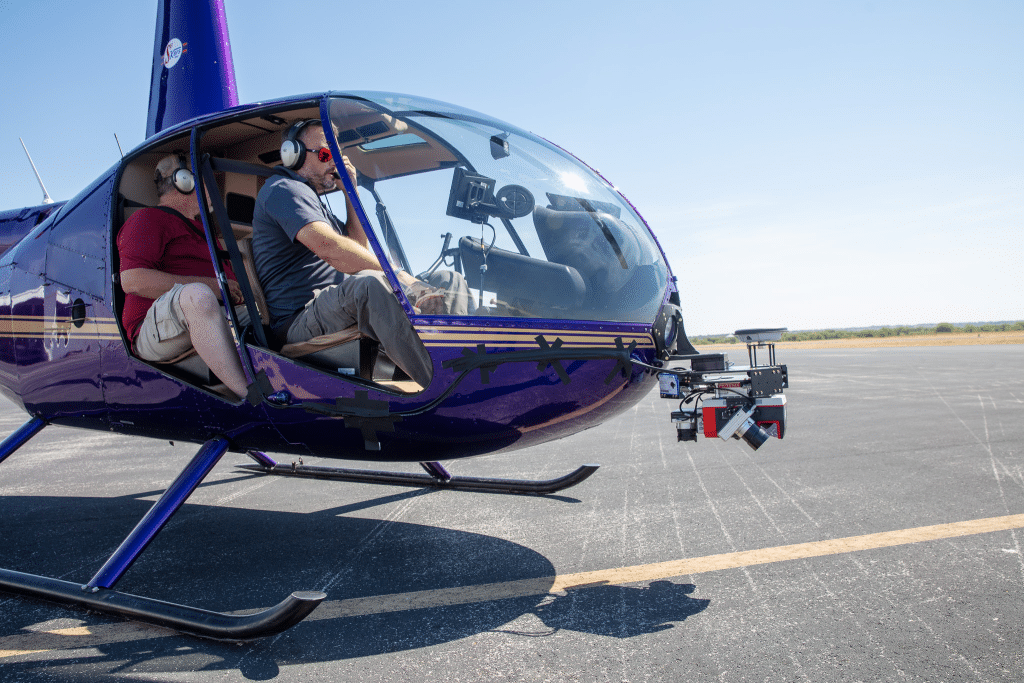
Utility companies managing power transmission networks face complex challenges in monitoring and maintaining infrastructure. The vast expanse of linear corridors and difficult terrain often render traditional survey methods impractical. Aerial LiDAR offers an efficient, innovative solution by capturing detailed tower and conductor geometries, detecting vegetation encroachment and hazards, and generating survey-grade terrain models—all with unmatched speed and accuracy.
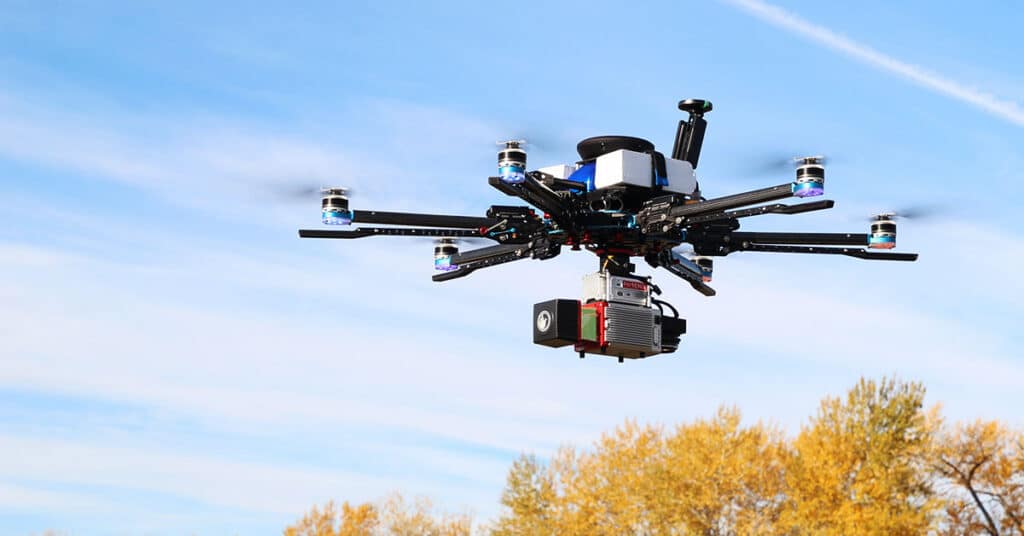
Phoenix LiDAR Systems provides flexible hardware options for every inspection task, including vehicle-mounted, UAV, and helicopter-based LiDAR systems. This adaptability ensures the right tool for any job, whether mapping narrow corridors or covering large areas.
Comprehensive Right-of-Way Mapping
Aerial LiDAR enables utility providers to efficiently collect high-density 3D data along power line corridors. With this technology, utilities can:
- Capture detailed tower structures and conductor geometries
- Detect vegetation encroachment and potential hazards
- Generate survey-grade terrain models for better clearance planning
Adaptable Hardware for Diverse Needs
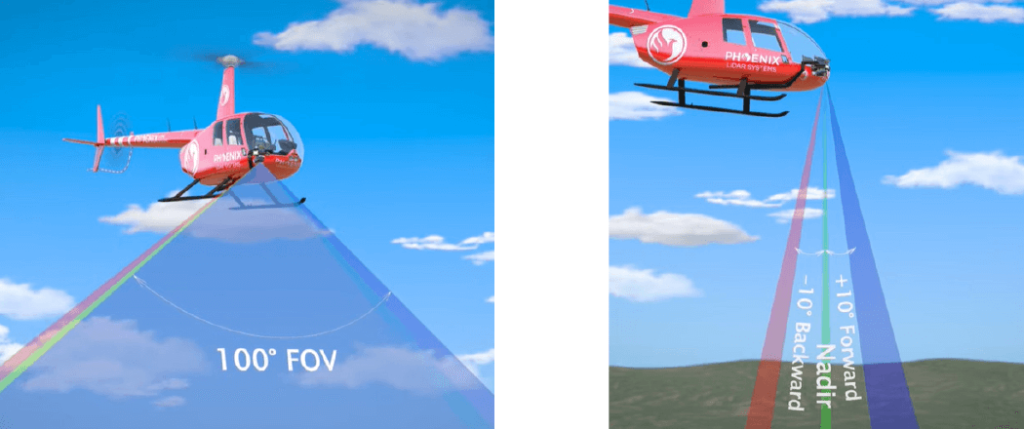
Phoenix LiDAR’s vehicle-mounted, UAV, and helicopter-based systems ensure the right tool for any utility inspection task. The RANGER-U240 covers wide areas from high altitudes, the RANGER-U120 and RANGER-U160 series with their NFB VFOV allow for single pass scanning of vertical structures, while the SCOUT M2X series excels at narrow corridor mapping.
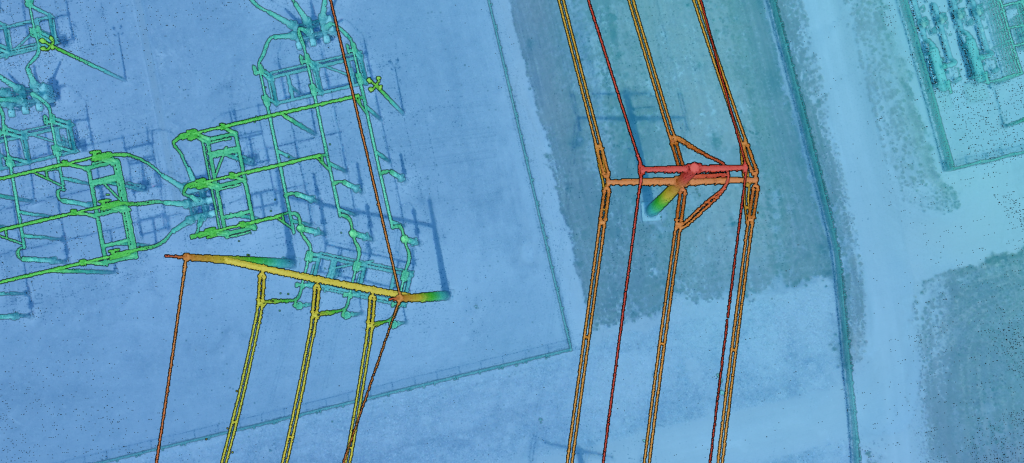
Powerful Data Processing and Insights
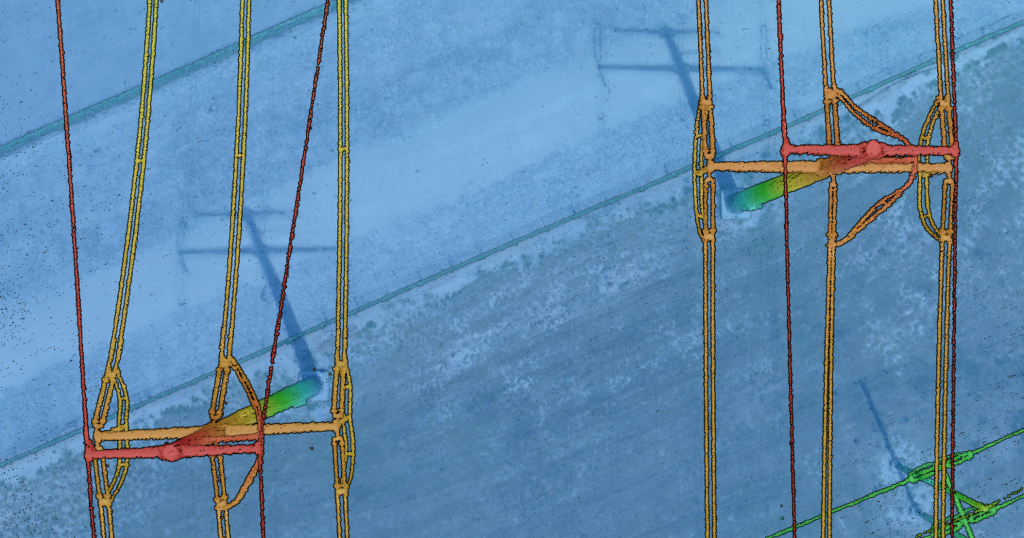
Point cloud classification and vectorization transform raw LiDAR into actionable insights, including:
- Conductor sag analysis for wire loading assessments
- Vegetation encroachment detection for maintenance planning
- Survey-grade digital elevation models for clearance planning
Key Benefits for Utility Providers
Aerial LiDAR empowers utilities to streamline critical inspection workflows, with benefits like:
- Identifying clearance issues and mitigating risks
- Improving compliance reporting and asset management
- Making data-driven decisions with survey-grade accuracy
Competitor insights reinforce the advantages of LiDAR’s accuracy, cost-effectiveness, flexibility, and safety compared to traditional methods. UAV-mounted LiDAR, in particular, enables frequent monitoring of fast-growing vegetation and surveying of hard-to-access areas.
Learn how LiDAR can revolutionize your utility inspection operations. Contact us to get started.
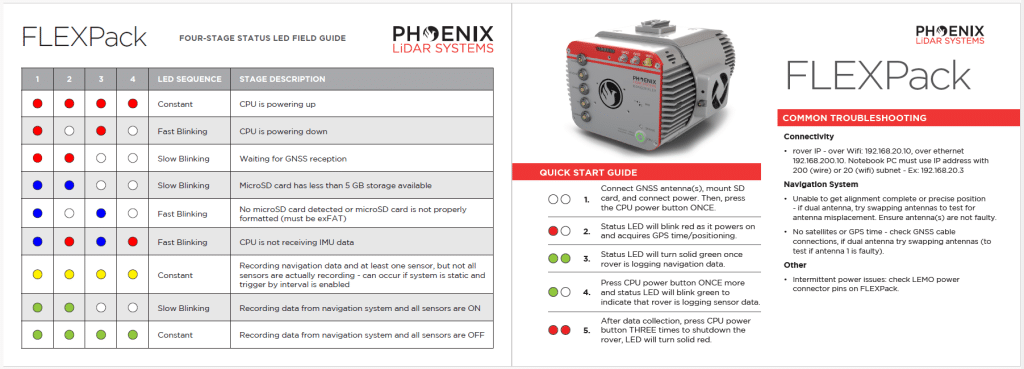
Ensure your LiDAR system is ready for field operations with our comprehensive RANGER Flex LED Quick Start Guide. Download now to streamline setup and maximize performance.
Discover the comprehensive guide to selecting the right LiDAR system with our detailed LiDAR Selection Guide. This article covers everything from the basics of LiDAR technology to in-depth comparisons of current scanners. Learn about the technical specifications, platform configurations, and software considerations essential for optimizing your LiDAR mapping projects.
Whether you are in forestry, construction, or surveying, our guide provides the insights needed to choose the best LiDAR solution for your needs. Read on to understand the advantages of UAV LiDAR, the components that make up a LiDAR system, and how to achieve high precision and accuracy in your mapping endeavors.
Phoenix LiDAR System offers survey-grade LiDAR systems for a variety of industries and applications.
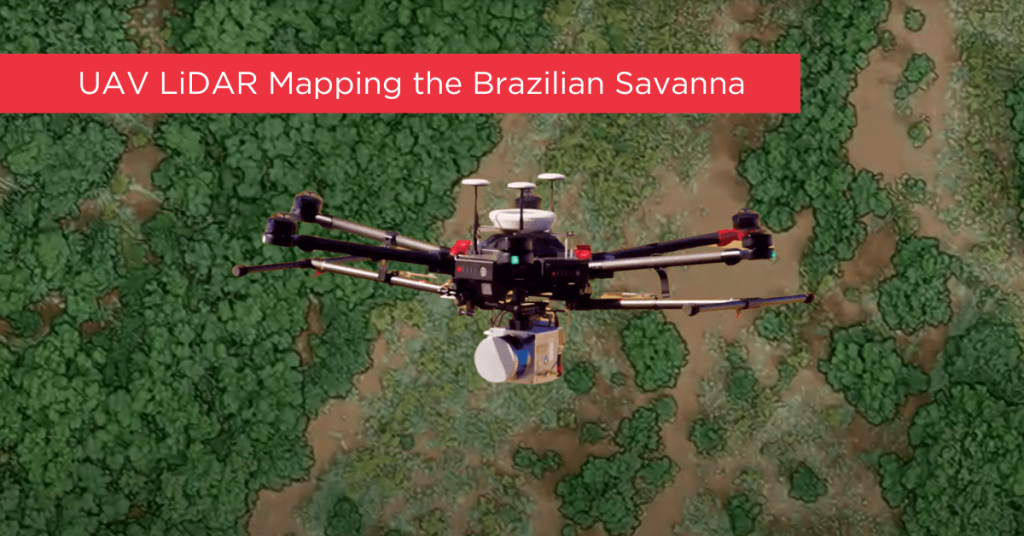
Tropical savanna ecosystems play a critical role in the global carbon cycle, but their ability to store and sequester carbon is uncertain due to the combined effects of anthropogenic activities and climate change. This study explores the potential of UAV LiDAR technology for accurate 3-D mapping of aboveground biomass (AGB) in the Brazilian Savanna (Cerrado).
By assessing five regression models using field sample plots, the research identifies the most effective model for estimating AGB across forest, savanna, and grassland formations. Results indicate that UAV LiDAR can significantly enhance biomass estimation, with notable accuracy across different vegetation types, although further development is needed for grassland biomass estimation.
These findings provide essential data for carbon emission mitigation strategies and support integrated fire management in tropical savanna ecosystems.
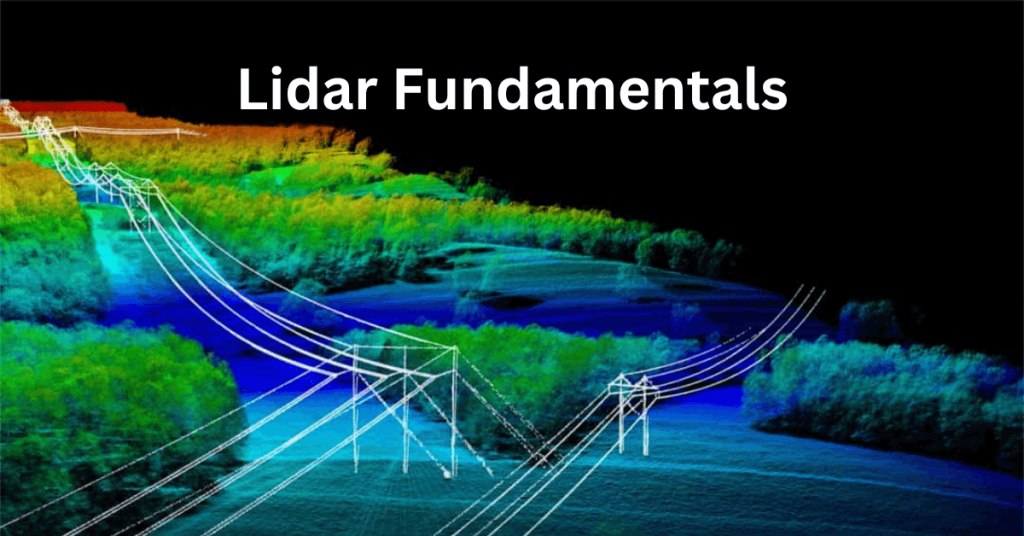
Understanding LiDAR
LiDAR 3D mapping is a versatile technology that surpasses passive sensing methods like photogrammetry by penetrating vegetation and operating effectively in low-light conditions. As a more applicable and user-friendly technology, LiDAR provides data that is quicker and easier to process. Phoenix LiDAR’s aerial solutions enable faster and more consistent area scanning compared to traditional ground scanning technologies, whether terrestrial or mobile mapping methods are used.
This section is designed to educate our customers and the public about LiDAR, highlighting the unique and innovative aspects of our solutions for a wide range of applications. Discover how Phoenix LiDAR sets the standard for efficiency and accuracy in 3D mapping.
LiDAR, short for Light Detection and Ranging, is an advanced remote sensing technology used across a wide range of applications. Utilizing pulsed laser light, LiDAR measures distances through vegetation to the Earth’s surface, capturing precise surface data by calculating the time it takes for the laser pulses to return to their source.
To operate effectively, LiDAR systems require four essential components:
- The LiDAR Unit: This device emits pulses of light and, when mounted on a UAV, scans a predefined swath below.
- GPS Receiver: Tracks the unit’s x, y, z coordinates for precise location data.
- Inertial Measurement Unit (IMU): Monitors the unit’s tilt in space to ensure accurate elevation measurements.
- Computer: Records and processes all transmitted data.
These light pulses, capable of producing multiple returns, are processed alongside other system data to generate highly accurate three-dimensional information about the scanned surface. This powerful combination of technologies makes LiDAR an invaluable tool for producing detailed and reliable 3D mapping data.
How Does LiDAR Work?
The technique we employ to achieve centimeter-level precision is Real Time Kinematic Global Navigation Satellite System (RTK GNSS). This system enhances the satellite signal’s carrier wave along with the information content, relying on a single GNSS reference station for real-time corrections. During short GNSS outages, the Inertial Navigation System (INS) steps in.
The INS uses a computer, accelerometers, and gyroscopes to continuously calculate the system’s position, orientation, and velocity. To combine these systems, a sophisticated algorithm called linear quadratic estimation (LQE) processes streams of noisy sensor data, producing an optimal estimate of the system’s position at any given time. By fusing this information with the LiDAR data, a point cloud is generated and visualized in real-time using Phoenix Aerial SpatialExplorer.
In scenarios where real-time corrections from the GNSS reference station are unavailable or prolonged outages occur, the third-party software Inertial Explorer™ can produce a precise trajectory in post-processing. Both real-time INS-generated trajectories and post-processed trajectories from Inertial Explorer™ can be fused with LiDAR data using Phoenix Aerial SpatialFuser to create point clouds in LAS format.
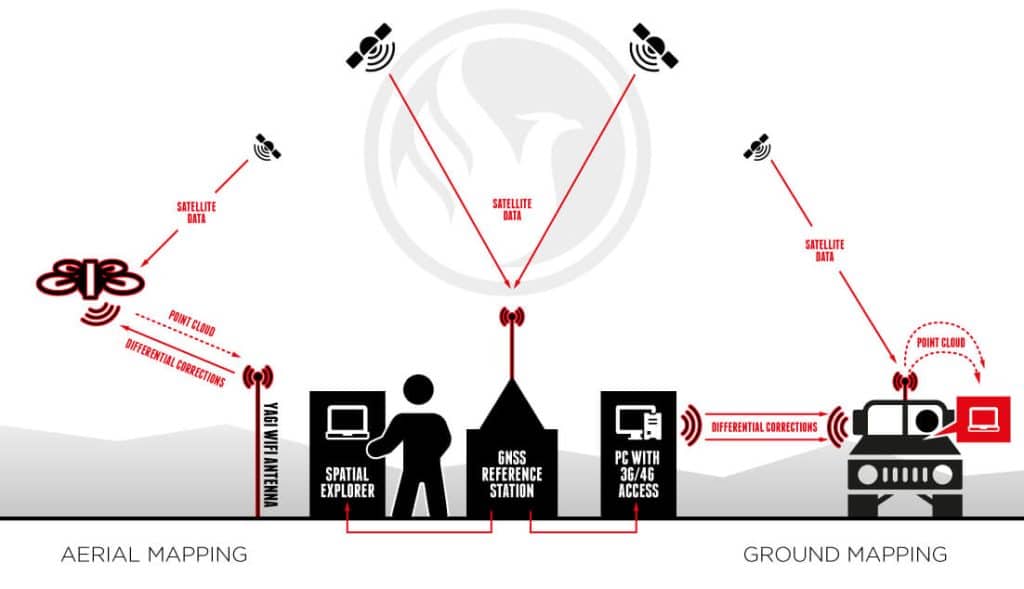
Phoenix Aerial LiDAR solutions are designed to attach to almost any vehicle, with flexible software to match. By separating sensor control from the user interface, multiple mapping options become possible:
Aerial Mapping Phoenix Aerial LiDAR solutions can be mounted on various vehicles such as UAVs, gyrocopters, and fixed-wing aircraft. Typically, the operator remains on the ground, connected to the GNSS reference station. Using Phoenix Aerial SpatialExplorer software, correction data is transmitted to the Rover via a long-range WiFi system. The Rover fuses this data in real time and transmits a down-sampled point cloud back to the operator.
Ground Mapping When traveling with the Rover in a car, boat, or ATV, the operator can connect directly to the Rover using WiFi or an ethernet cable. Correction data is transmitted from the GNSS reference station to the SpatialExplorer software via long-range WiFi or a public IP address (using 3G/4G). With an onboard 240 GB SSD hard drive, the operator can scan for up to 6 hours without needing to stop for data downloads.
Real-time Point Cloud Advantages Real-time point cloud visualization offers several key benefits:
- Immediate Results: Operators can instantly determine if the results meet expectations, avoiding the time-consuming and costly process of post-flight adjustments.
- Real-time Navigation: The growing point cloud can be visualized on a computer screen in real time, allowing the operator to identify unscanned areas and quickly alter the UAV’s course.
- Remote Collaboration: Through a 4G network, operators can share their screen with clients in real time to confirm or adjust the LiDAR point cloud.
Phoenix Aerial LiDAR solutions provide unparalleled flexibility and precision, making them an essential tool for various mapping applications. Whether for aerial or ground-based operations, our technology ensures high-quality, accurate data collection and real-time processing capabilities.
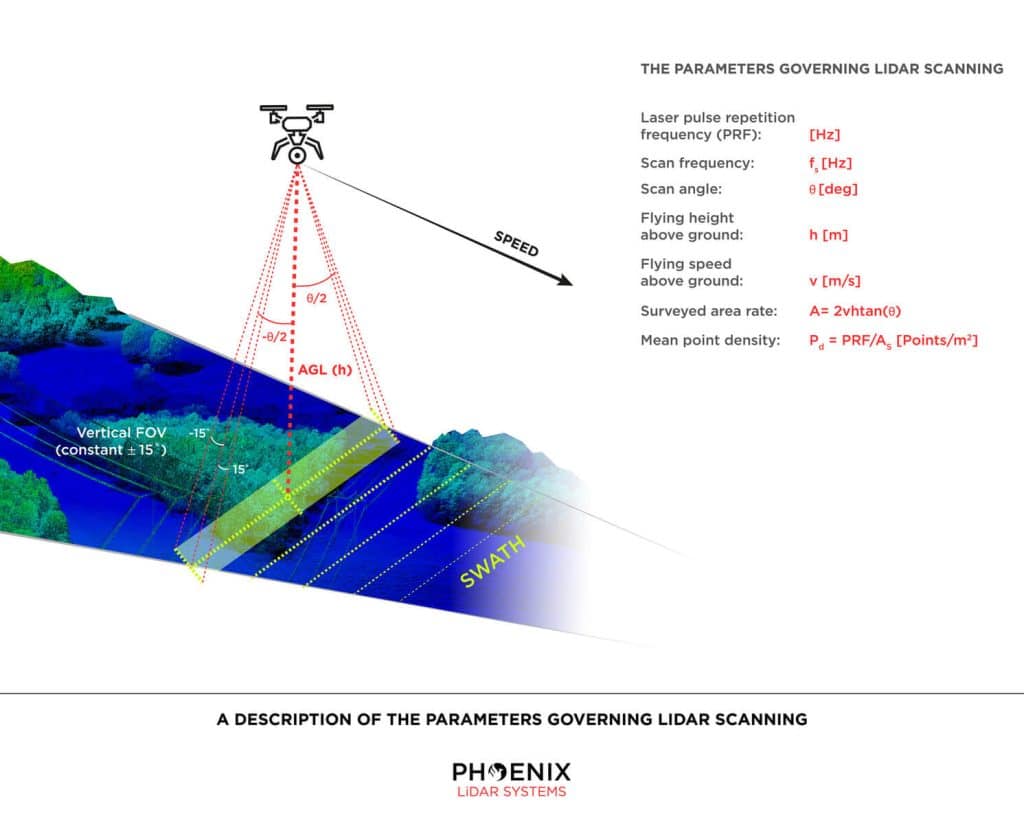
Parameters for LiDAR Scanning Via UAV
Phoenix LiDAR Systems builds systems meant for mobile mapping. Surveying from a moving object is accompanied by certain parameters an operator must take into account: speed, scan area, altitude, frequency, pulse rate, scan angle and point density all play an integral role in capturing data. Note that you will obtain a scan swath of varying ranges and densities depending on these parameters. Actual accuracy is dependent on GPS processing options (RTK, PPK, WAAS), ionospheric conditions, satellite visibility, flight altitude (AGL) and other factors.
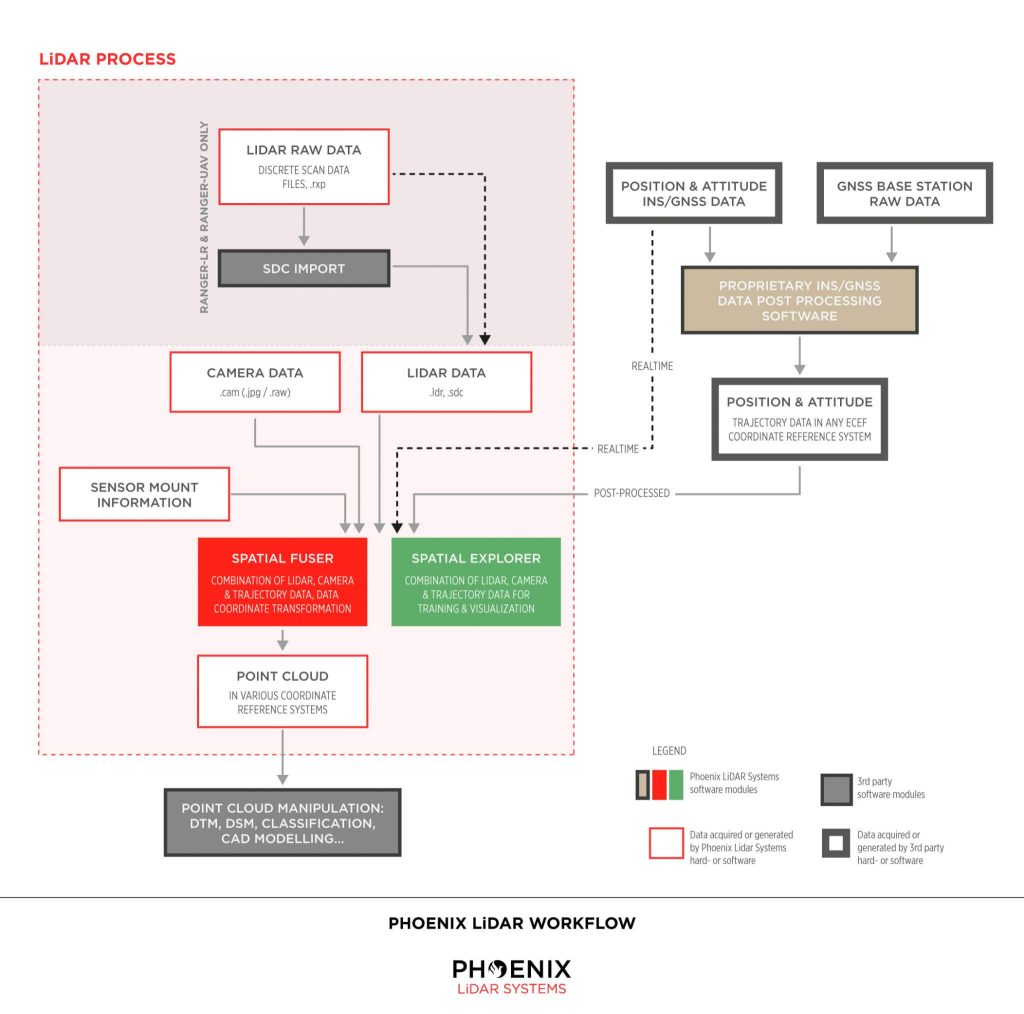
Phoenix LiDAR Workflow
Real-time vs Post Processed
In RTK (Real Time Kinematic) mode, about 500 bytes of differential corrections are sent from the reference station to the rover about once every second. Applying these corrections, the rover is able to solve its position with centimeter-accuracy.
The differences between RTK mode and post-processing are:
- post-processing requires extra software
- post-processing does not require a real-time connection between reference station and rover
- post-processing will often compute more accurate results, especially in environments with bad satellite visibility (ground scanning)
- post-processing allows the user to better judge the solution’s accuracy
Need More Help?
We understand that LiDAR technology can be overwhelming. Don’t worry. We’re here to help. Contact us Monday – Friday, 9am – 5pm PST.
+1.323.577.3366

The Purpose of LiDAR
LiDAR (Light Detection and Ranging) is an advanced tool used for quickly, accurately, and densely measuring 3D features from the surrounding environment. As a form of remote sensing, LiDAR employs sensors to gather data on topography, vegetation, and other features across large areas, eliminating the need for physical measurements.
LiDAR sensors can capture hundreds of thousands of measurements per second, represented as a point cloud. This point cloud is crucial for various analytical processes, including distance measurements, volume computations, and 3D modeling.
How Does LiDAR Work?
LiDAR measures distance by emitting laser pulses and recording the time it takes for each pulse to travel to an object and reflect back to the sensor. Given the known speed of light, distance is calculated using the formula: distance = speed x time. Positioning and orientation sensors within the LiDAR system then convert these distance measurements into elevation data.
Position measurements are typically recorded once per second, while orientation measurements are taken between 125 and 400 times per second. These sensors are essential for accurately calculating the location and timing of each point collected by the LiDAR system.
In essence, a LiDAR system is an active remote sensing technology that emits laser pulses, captures the returned signals, and calculates the system’s position and orientation. This process produces a geospatially accurate 3D point cloud depicting the environment.
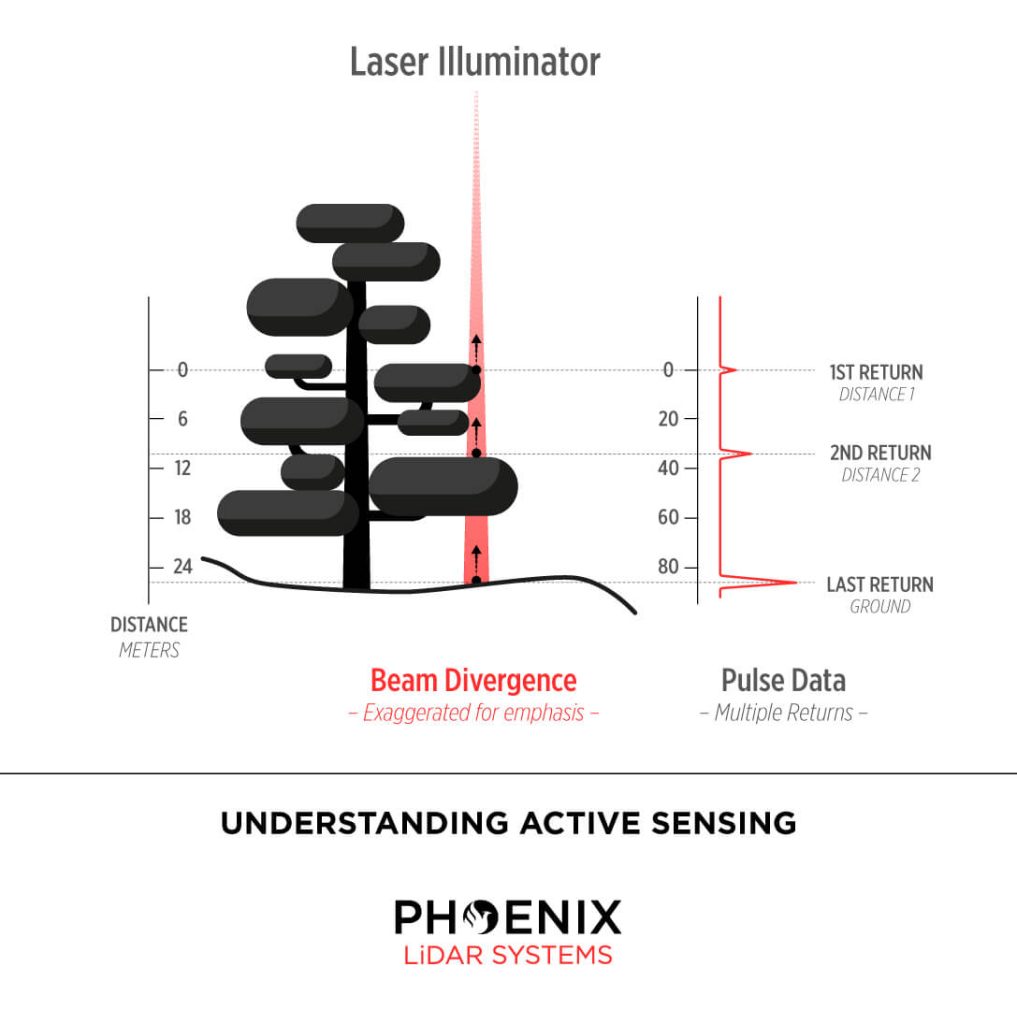
How Can LiDAR Measure the Ground Through Trees?
LiDAR operates by emitting laser pulses composed of light energy in the form of photon bundles. As these photons travel towards the ground, they encounter various objects such as buildings, trees, and vegetation. Some photons reflect off branches and return immediately to the sensor, while others pass through gaps in the foliage, striking lower branches or the ground before reflecting back.
This process, known as multiple returns, allows LiDAR to capture multiple reflections from a single pulse of light. The power of the laser and other factors determine the number of returns a LiDAR system can record. At Phoenix LiDAR Systems, some systems can record up to 15 returns, providing a true 3D representation of both vegetation and ground data.
Phoenix LiDAR Systems offers a range of high-performance LiDAR solutions capable of capturing detailed, accurate 3D data for a variety of applications.