ResourceType
Colorized RANGER-FLEX RFM2 dual head data set, utilizing the Mosaic X panoramic camera for colorization.
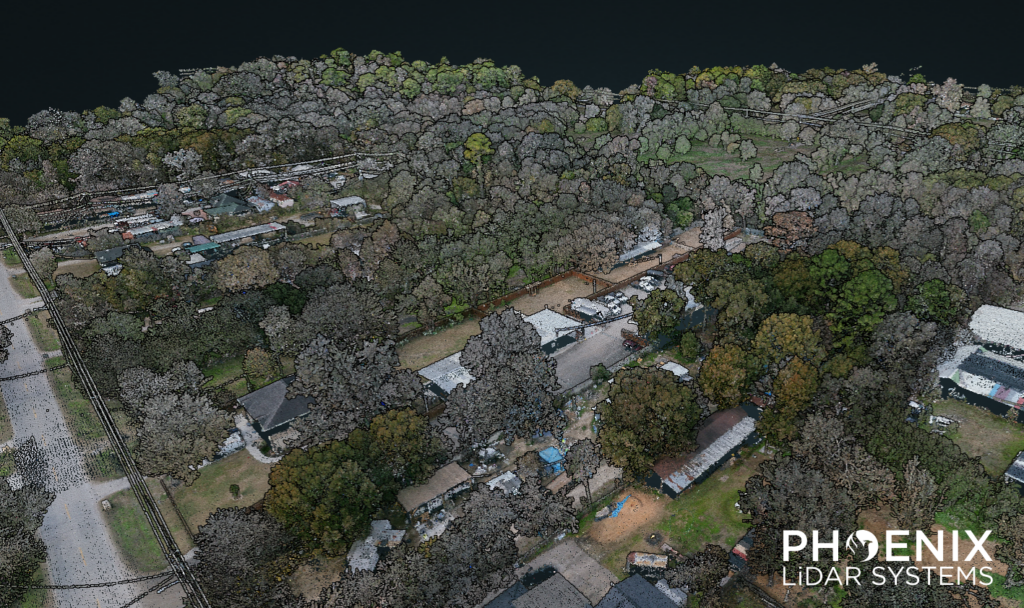
This RECON-F4 demo was collected during 2 flights at 80 m AGL (although this scanner is capable of producing great data even higher), 10 m/s with the RECON-F4, and processed in SpatialExplorer. Relative accuracy between flightlines came in at 0.064 US-ft, and the data hit surveyed check points at 0.07 US-ft without needing adjustment to control. The point cloud was colorized using imagery from the integrated full-frame camera.
LiDAR remote sensing systems utilizing GNSS/INS are reliant on the integration of
an accurate Inertial Measurement Unit (IMU) to achieve high-quality data. The IMU
forms the core of the navigation system, which is used to estimate a trajectory. This
trajectory is then used for georeferencing (“fusing”) raw LiDAR range data into a point
cloud. IMUs vary in terms of performance and price, so selecting the right IMU for a
given LiDAR application is an important step.
IMU hardware collects data from gyroscopes and accelerometers. Gyroscopes, which
are used to measure rates of rotation along 3 axes (roll, pitch, and yaw), have inherent
measurement imperfections. When a gyroscope is stationary and not rotating, output
measurements, which should be constant due to the lack of rotation, will in fact change,
or drift, over time. It’s important to consider that an IMU may drift along certain axes,
even when not completely stationary. For example, traveling with a constant heading
means that the gyroscope associated with measuring heading is nearly at rest and
subject to drift. Drift along the heading axis is typically more impactful than the drift
observed along the pitch and roll axes, as “A good portion of the pitch (attitude) and roll
axis gyroscope drift can be removed within an IMU through the use of accelerometer
feedback to monitor position relative to gravity” (Analog Devices, 2017).
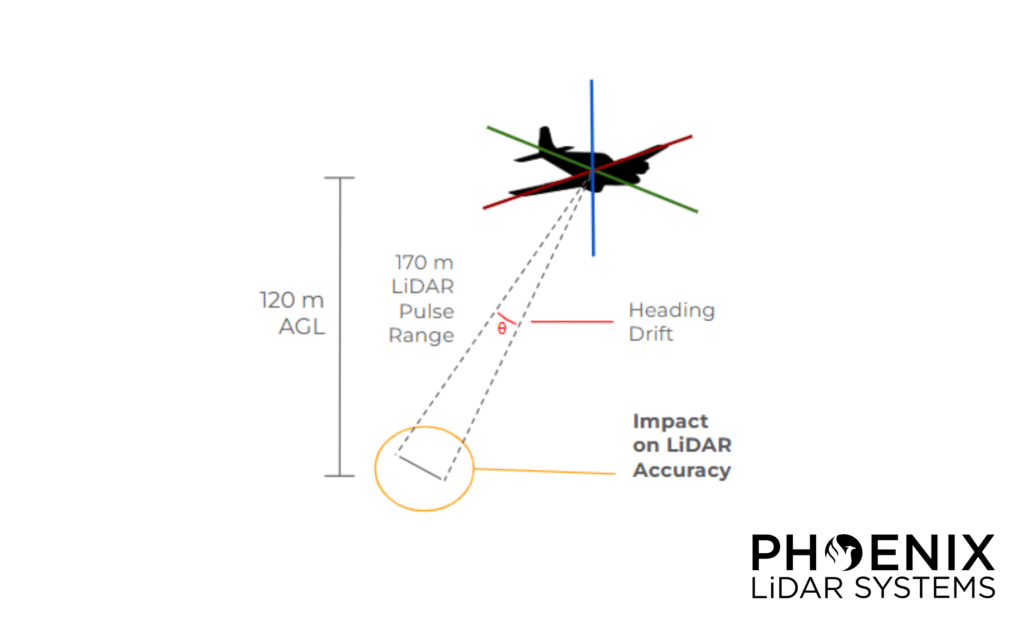
Heading drift is most pronounced when a vehicle travels in a relatively straight path
for a prolonged period of time, as heading estimates degrade in accuracy due to an
accumulation of gyroscope noise. This is particularly problematic with aerial LiDAR
data acquisition, as single-grid type and corridor acquisitions must take into account
how long the IMU can travel in a straight path without accumulating too much drift.
To mitigate this, operators will typically limit their flight line lengths accordingly or
perform dynamic maneuvers in the middle of long flight lines.
Download the whitepaper to learn more.
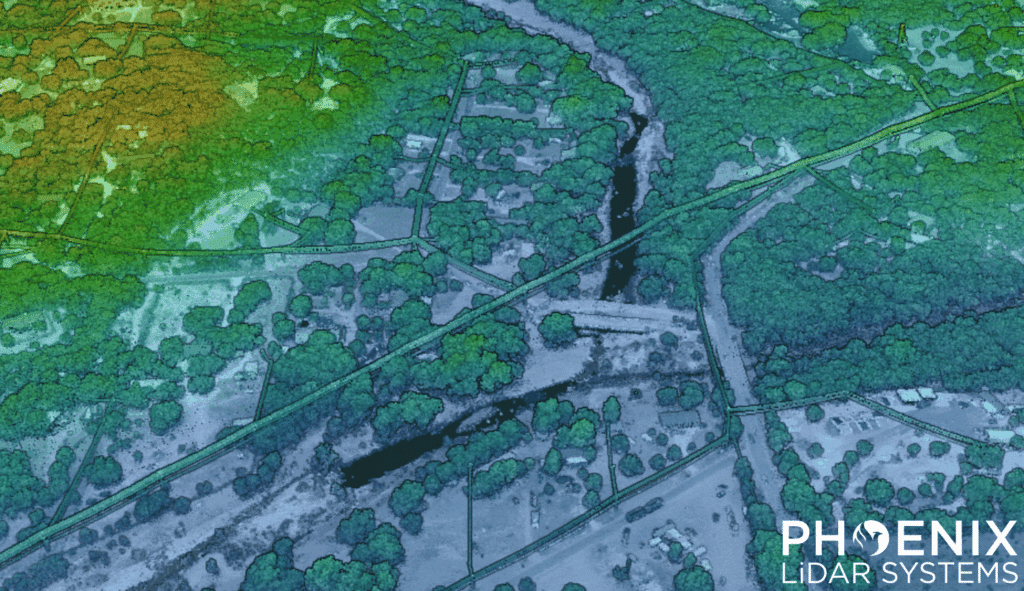
The RANGER-U240 was flown over Big Sandy Creek in Texas for post flood mapping at 250 m AGL, 65 knots. The result was 130 points/square meter, per line.
In July 2025, the Texas Hill Country experienced a devastating and deadly flooding event. As an Austin-based company, the Phoenix LiDAR team felt a strong responsibility to contribute in any way we could. First by volunteering in recovery efforts, and then by deploying our LiDAR technology to capture the effects in the aftermath.
To better understand the impact, our team conducted a manned mission with a Robinson R44 helicopter, deploying the 𝗥𝗔𝗡𝗚𝗘𝗥-𝗨𝟮𝟰𝟬 LiDAR system with a PhaseOne iXM-GS120 camera to capture high-resolution post-flood data.
Floods reshape entire communities, and understanding their impact is critical for recovery. Our team captured and processed post-flood LiDAR, creating a dataset that may be of interest to researchers, planners, and engineers working on:
- Flood modeling
- Understanding flood risks
- Infrastructure resilience
- Planning
We’re making this dataset publicly available in hopes it can support anyone who can use it for research, inform cleanup, planning, or long-term flood mitigation.
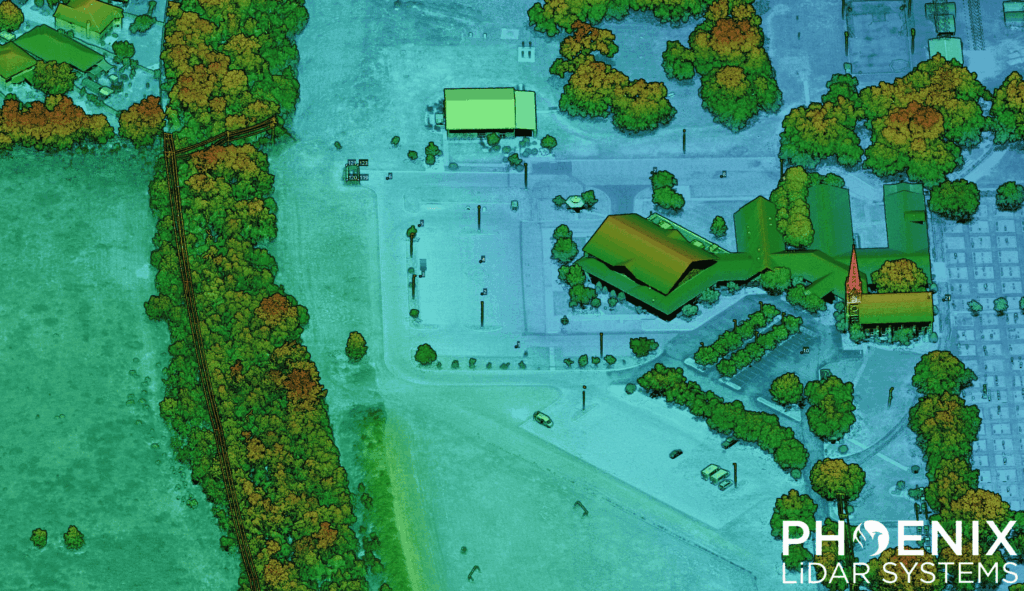
The RECON-F4 was flown at 120 m for a mapping flight at Phoenix LiDAR’s calibration site, flown at 6 m/s.
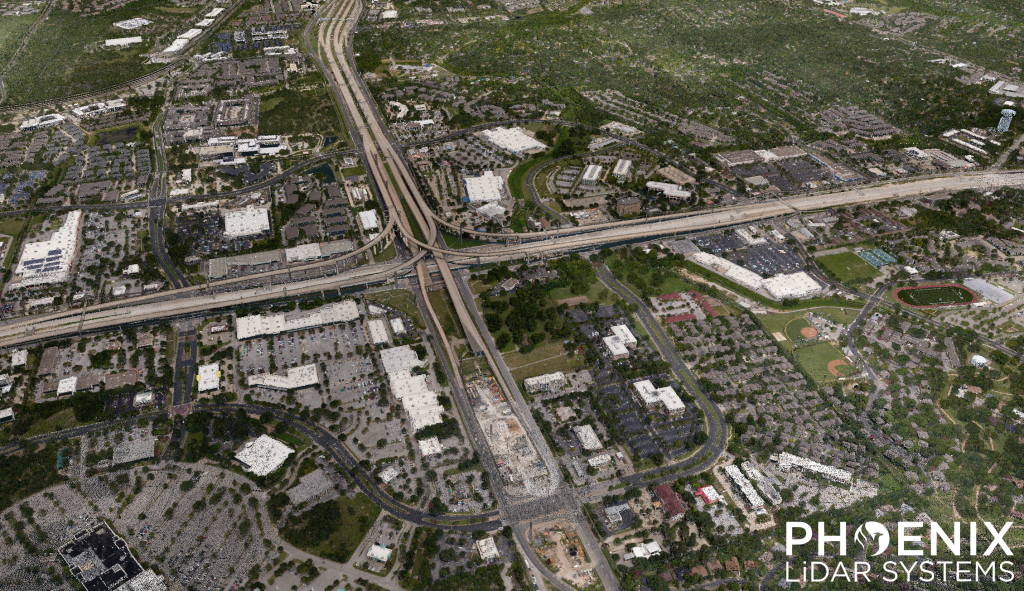
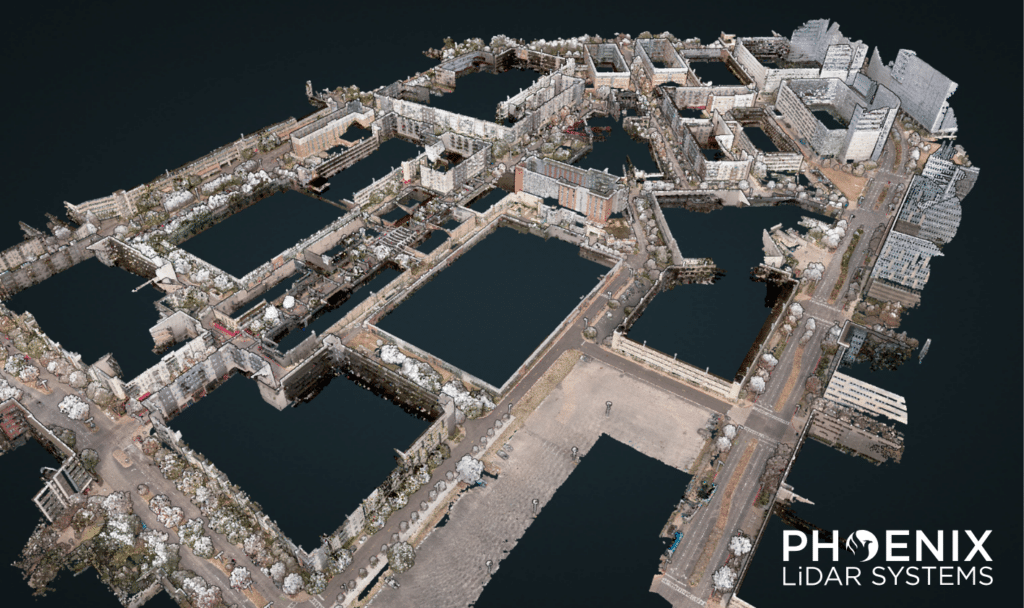
This RANGER-U580 sample dataset covers roughly 50 square miles of North Austin, Texas.
The project was flown with a Cessna 172 at 75 knots and 615 m above ground level. Data was processed in SpatialExplorer version 9.
Results:
34 points/m², per flight line
7 cm GSD
Full RANGER-U580 dataset available for download. Contact our team at sales@phoenixlidar.com for a link to download.
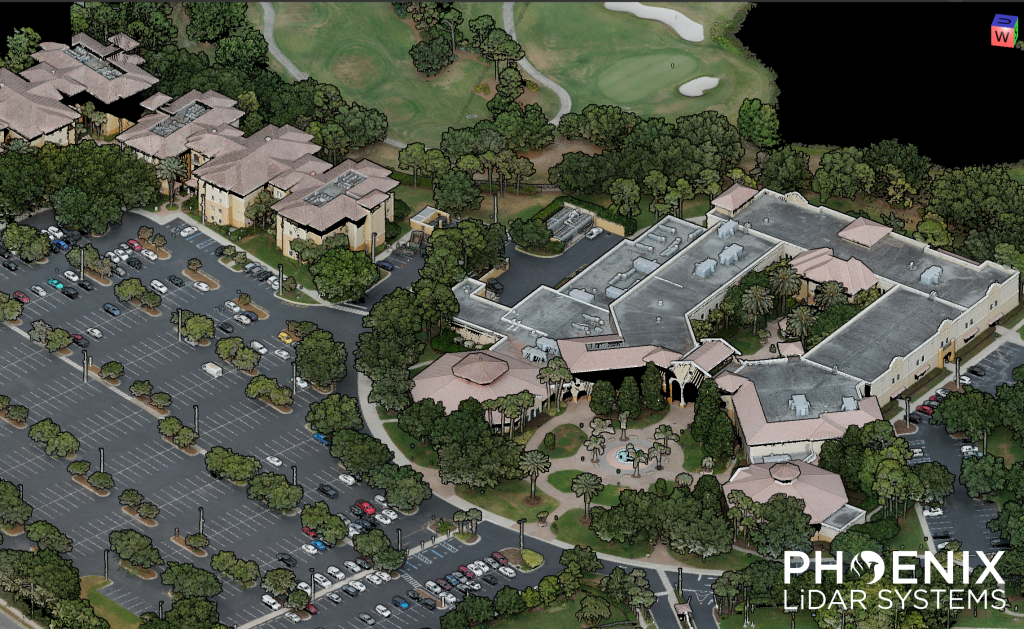
Check out our RANGER-Flex 𝗠𝗼𝗯𝗶𝗹𝗲 + 𝗔𝗲𝗿𝗶𝗮𝗹 𝗱𝗮𝘁𝗮 𝘀𝗲𝘁 of the University of Central Florida – Rosen College of Hospitality Management, recorded during the 2025 TopoDOT User Conference.
This data set features mobile and aerial scans by the RANGER-Flex, which were matched together using 𝗟𝗶𝗗𝗔𝗥𝗦𝗻𝗮𝗽. First, the site was flown using a single 𝗥𝗔𝗡𝗚𝗘𝗥-𝗙𝗹𝗲𝘅 LiDAR system mounted to a Harris Aerial 𝗛𝟲𝗘. Then, this same aerial LiDAR system was mounted inside the 𝗥𝗙𝗠𝟮 𝗺𝗼𝗯𝗶𝗹𝗲 𝘀𝘆𝘀𝘁𝗲𝗺, which enables dual-head mobile LiDAR collection.
Once the mobile data set was collected, the scans were matched together automatically using 𝗟𝗶𝗗𝗔𝗥𝗦𝗻𝗮𝗽’𝘀 𝗖𝗼𝗻𝘁𝗿𝗼𝗹 𝗖𝗹𝗼𝘂𝗱 functionality. Both scans were then colorized using the 𝟲𝟭 𝗠𝗣 𝗥𝟲 aerial camera.
Full Dataset available for download. Contact our team at sales@phoenixlidar.com for a link to download.
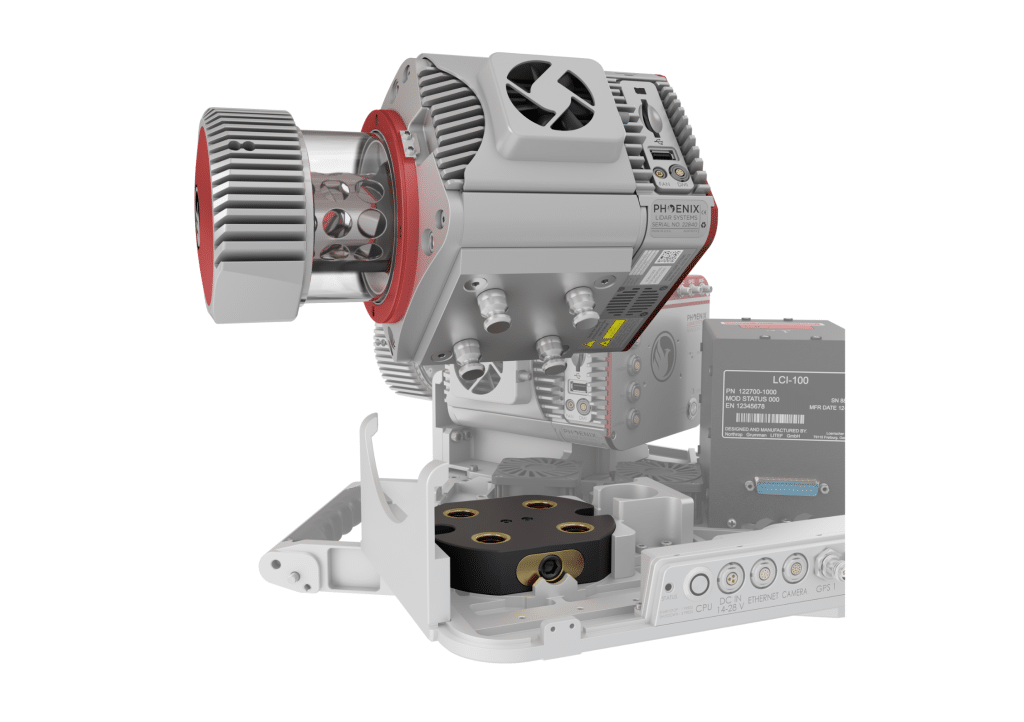
Modularity is a key feature of the RANGER-FLEX laser mapping product line.
These systems can be quickly reconfigured, with sensors added and/or removed, to allow for optimized utilization on a variety of vehicle types. Modularity also presents a challenge: How can a system calibration, which is a cornerstone of data accuracy, be preserved if laser scanners and cameras are routinely separated from each other and from the navigation system? The RANGER-FLEX has been engineered to specifically address this, and a series of datasets were collected to test the stability of its calibration.
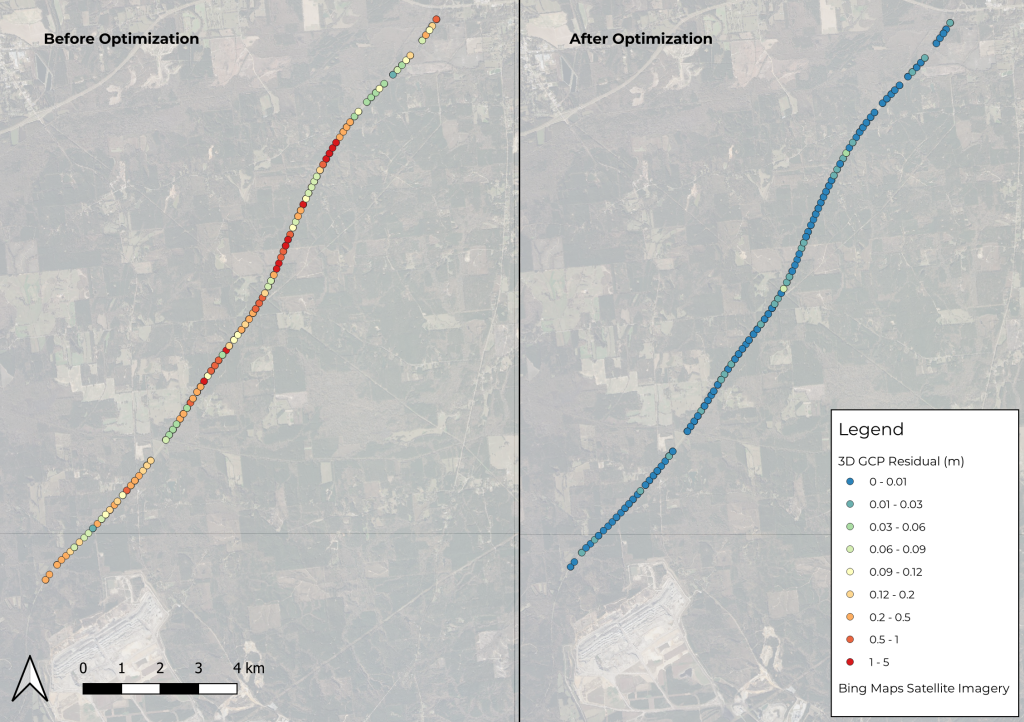
Phoenix LiDAR’s SpatialExplorer’s LiDARSnap strip alignment tool was tested using a challenging mobile LiDAR dataset collected along a rural state road, Natchez Trace Parkway, near Mathiston, Mississippi. Approximately 17.5 km of the parkway was mapped using the RANGER Flex dual-head mobile LiDAR mapping system.
Of the total mapped area, nearly 85% was covered by a dense tree canopy, which posed a significant accuracy challenge due to the limited availability of GNSS signals. LiDARSnap was utilized not only to calibrate the relative accuracy of the two passes but also to georeference the scan in relation to leveled control.
This paper discusses the processing workflow, results, and capabilities of LiDARSnap in challenging, GNSS-denied environments.